


Effective project management is integral to the success of any company, regardless of its industry or what it does. There are many pitfalls, but creating project management infographics can help keep your team on task and ease up your project planning process.
Whether you’re launching a new product, constructing and moving into new headquarters, or simply looking for a visual communications tool to keep projects on track, project management infographics could be right for you.
With Venngage’s Infographic Maker, you can quickly and easily bring your ideas to life, and thanks to My Brand Kit, you can ensure all your project management infographics are designed with your brand identity.
NEW! Introducing: Marketing Statistics Report 2022
It’s 2022 already. Marketers, are you still using data from pre-COVID times?
Don’t make decisions based on outdated data that no longer applies. It’s time you keep yourself informed of the latest marketing statistics and trends during the past two years, and learn how COVID-19 has affected marketing efforts in different industries — with this FREE marketing statistics report put together by Venngage and HubSpot.
The report uses data gathered from over 100,000 customers of HubSpot CRM. In addition to that, you’ll also know about the trends in using visuals in content marketing and the impacts of the pandemic on visual content, from 200+ marketers all over the world interviewed by Venngage.
Grab your copy now — it’s not like any other marketing reports out there, plus it’s 100% free!
Let’s look at some examples of project management infographics to get your creative juices flowing before you get started on yours.
Want to learn more about other types of infographics? Read our blog on the 9 main types of infographics or watch the video below:
Click to jump ahead:
- Project management infographic examples
- Construction infographic
- Project timeline infographic
- Gantt chart infographic
- Project status infographic
- Project plan infographic
- PMO infographic
- Project manager infographic
- Project progress infographic
Project management infographic examples
According to the Project Management Institute’s most recent analysis, nearly one in four major projects by organizations failed to fully meet the goals established, while about 12% were deemed complete failures.
Project managers need all the help they can get to ensure project success, including meeting budgets, timelines and organizational goals.
Compared to organizations using only traditional project management methods, according to PMI, those that use cutting-edge and emerging methods are more likely to have successful outcomes, including meeting all goals, finishing within budget and on schedule and avoiding scope creep.
Project management infographics take advantage of the promise of visual communications by empowering team members with critical information and helping them visualize goals, schedules and more.
And they are right at home beside many other types of business infographics, including finance, sales, healthcare infographics, company infographics and more.
Project management infographics can take many forms, including some of the most popular types of infographics. Not sure how to get started planning your project? Check out the infographic below.

Project management infographics can track progress, visualize schedules and organize team members. Some can do all of that, as the example below does.

Construction infographic
The construction industry is one of the best candidates for project management infographics. That’s because the typical builder, contractor or other companies are involved in the trade deals with dozens of projects at once, and keeping all those plates spinning is a challenge.
When we talk about construction, a project management infographic is as important as a project management software, the first one can come before or during projects — depending on your needs; the latter helps you create solutions and optimize your workflow, reports and communication.

This example provides a simple template that any construction company could use to communicate with a potential client about a proposal. Budgets, timelines, scope and more are included, and the table on the last page is an excellent way to visualize and organize information.

A similar take on a construction proposal infographic strips out some of the information to serve a dual purpose: it’s also a contract. With fields for client and contractor to sign, this is an excellent way to ensure clear communication of a proposal.

Of course, all the planning in the world won’t do much good if you don’t keep projects on track, and this construction project infographic example provides a daily summary of expected and completed work, so all involved parties are on the same page.

With an approach nearly identical to the previous example but with a totally different illustrative style, this construction infographic illustrates how easy Venngage’s Infographic Maker makes customizing project management infographics to suit your company’s needs.
Project timeline infographic
About 45% of projects in PMI’s survey failed in part because they didn’t meet deadlines. Completing a project on time is generally one of the most important goals, and using a project timeline infographic to help do this is an excellent idea.

By their nature, timeline infographics are intuitive, and that’s true whether it’s a traditional infographic or whether it’s part of your project management process. The example above is packed with useful information, and the simple design gives all team members the details they require.
Project timeline infographics can also lean toward the simple side, like the one below that focuses solely on the project timeline, omitting the additional context provided in the previous example.

A smart approach in any infographic is not to give the audience more than they need, so a streamlined project timeline infographic could be appropriate.
Gantt chart infographic
Gantt charts have been popular in project management circles since Henry Gantt invented the bar chart-style method for visualizing project schedules, and in many organizations, Gantt charts are the default project timeline.
Today’s Gantt charts typically do more than simply visualize a series of dates. In this example, dates are listed across three broad buckets with individual tasks underneath them.

This makes it easy to see how tasks that don’t seem related may be happening at the same time. An approach like this is particularly useful for remote teams or those not working in the same department.

Gantt charts can also be a bit more straightforward like this example that spans an expected seven-month fundraising event. This could easily be adapted for companies where multiple teams will work on a project, whether by adding section headings or including icons related to each department.
Project status infographic
Providing timely updates is crucial to keeping projects moving along and hitting milestones. Project management infographics are perfect for doing this, and there are ways to work updates into your existing visual communication about the project.

In this example, the project timeline and steps are detailed via a bar chart and icons, and important updates are made as needed. The date of the most recent update is at the top right, ensuring team members always have the latest info.

Project status infographics can also stand on their own, as in this example, which provides weekly updates across a series of metrics related to the project.
Project plan infographic
Planning is another area of project management that’s perfect for using visual communications like infographics.

If your company’s project management strategy is in its infancy, this infographic may be able to help you put processes and procedures into place that can be replicated time and time again.
Related: 20+ Strategy Infographics for Business Planning, Marketing and Branding

Creating a project plan infographic is also useful for ensuring that everyone agrees to various milestones, and this is especially helpful for companies that deal with clients. A project plan infographic like this one could be used to help teams on both sides visualize the process so they can close any gaps that might exist.
PMO infographic
Increasingly, organizations are turning to project management offices (PMO), whether internal teams or external consultancies, to ensure their programs have success. According to a study by PM Solutions, about 85% of firms across the globe have a PMO in place to tackle project management.

PMO teams will likely need to create many Gantt charts, and we’ve already talked a bit about their usefulness. But here we see another example of a simple Gantt chart that your PMO could easily update for each new initiative.

PMO team members need to be experts in various aspects unique to their company. That could mean making sure everyone on the team understands certain policies. Your team could benefit from an infographic like this, which explains the rules of a Brazilian government program. This could easily apply to local ordinances, rules or customs that impact your organization.
Project manager infographic
The average project manager has a wide portfolio of responsibilities, and even they need some help from time to time.
So far, we’ve focused on how project managers can use infographics to keep their teams on track, but they can also use infographics to keep themselves on track.

In this Gantt chart example, the project manager has added individual contractors’ names, which will help them remember who is responsible for which tasks without going back through notes or other information. While this was created for a construction company, it’s easy to envision how it could be helpful for a project manager in any field.
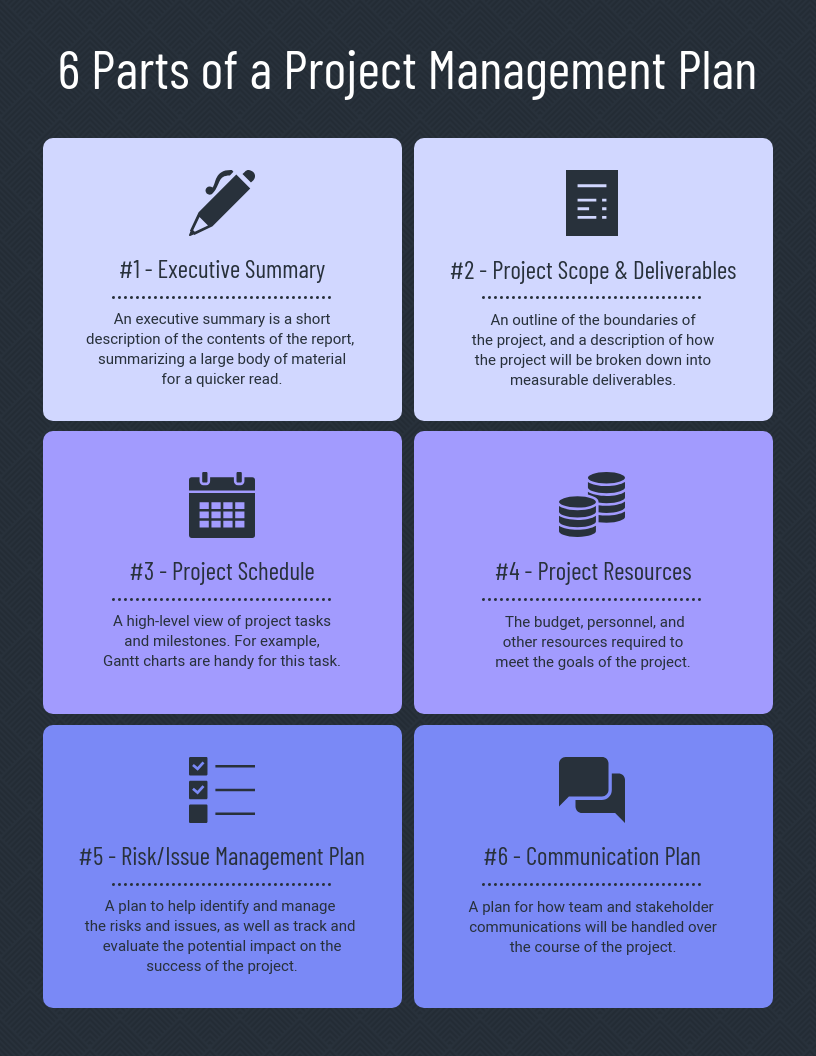
Project manager infographics can also help them keep a checklist of items in their mind, such as this infographic that details the key parts of a project management plan. Before long, these needs will be committed to memory, but most people could use a refresher every now and again.
Project progress infographic
Project progress infographics are excellent tools that PMOs, project managers and others can use to visualize what tasks have yet to be completed.

These can come in the form of Gantt charts, like this one, which uses checkmarks to denote how many days of the project have gone by.

Project progress infographics can come in a traditional timeline format like this one, which keeps track of what’s been done with “released” or “scheduled” labels for a company’s product.
Also read: 7 Ways to Show Product Value Using Infographics
In summary: A well-designed project management infographic that keeps your team on target could be a welcome addition to your entire organization
According to PMI, North American organizations complete projects within budget in only 62% of cases and on time by a rate of just 56%. That means the average company is wasting tons of time and money on poor project management.
We don’t promise they’ll cure all your ills, but project management infographics can be ideal tools for visualizing projects, setting schedules and expectations, and keeping teams engaged and enthusiastic.
Start creating your own project management infographics today with Venngage’s drag-and-drop editor and hundreds of easy-to-edit templates. You can also customize your infographics to reflect your company’s branding guidelines with My Brand Kit. It’s free to get started.